Turning a year of results into one readable story
At Visualink, I designed data storytelling for the Nashville division of Kroger for its 2016 marketing summit. The division gave $5.8 million to the community in 2015 through corporate giving, in-store fundraising, employee contributions, and special events, and its departments posted dozens of results worth celebrating. The challenge was mixing very different kinds of numbers (large dollar totals, growth percentages, rankings, and one-time highlights) without letting them blur together. I organized the story by department and gave each kind of number its own visual weight, with a consistent icon system and a restrained palette tying it all together.
- Type
- Data visualization, annual report, environmental graphics
- Role
- Graphic designer
- Scope
- Wall installation, annual report, icon system
- Status
- Delivered for the 2016 marketing summit
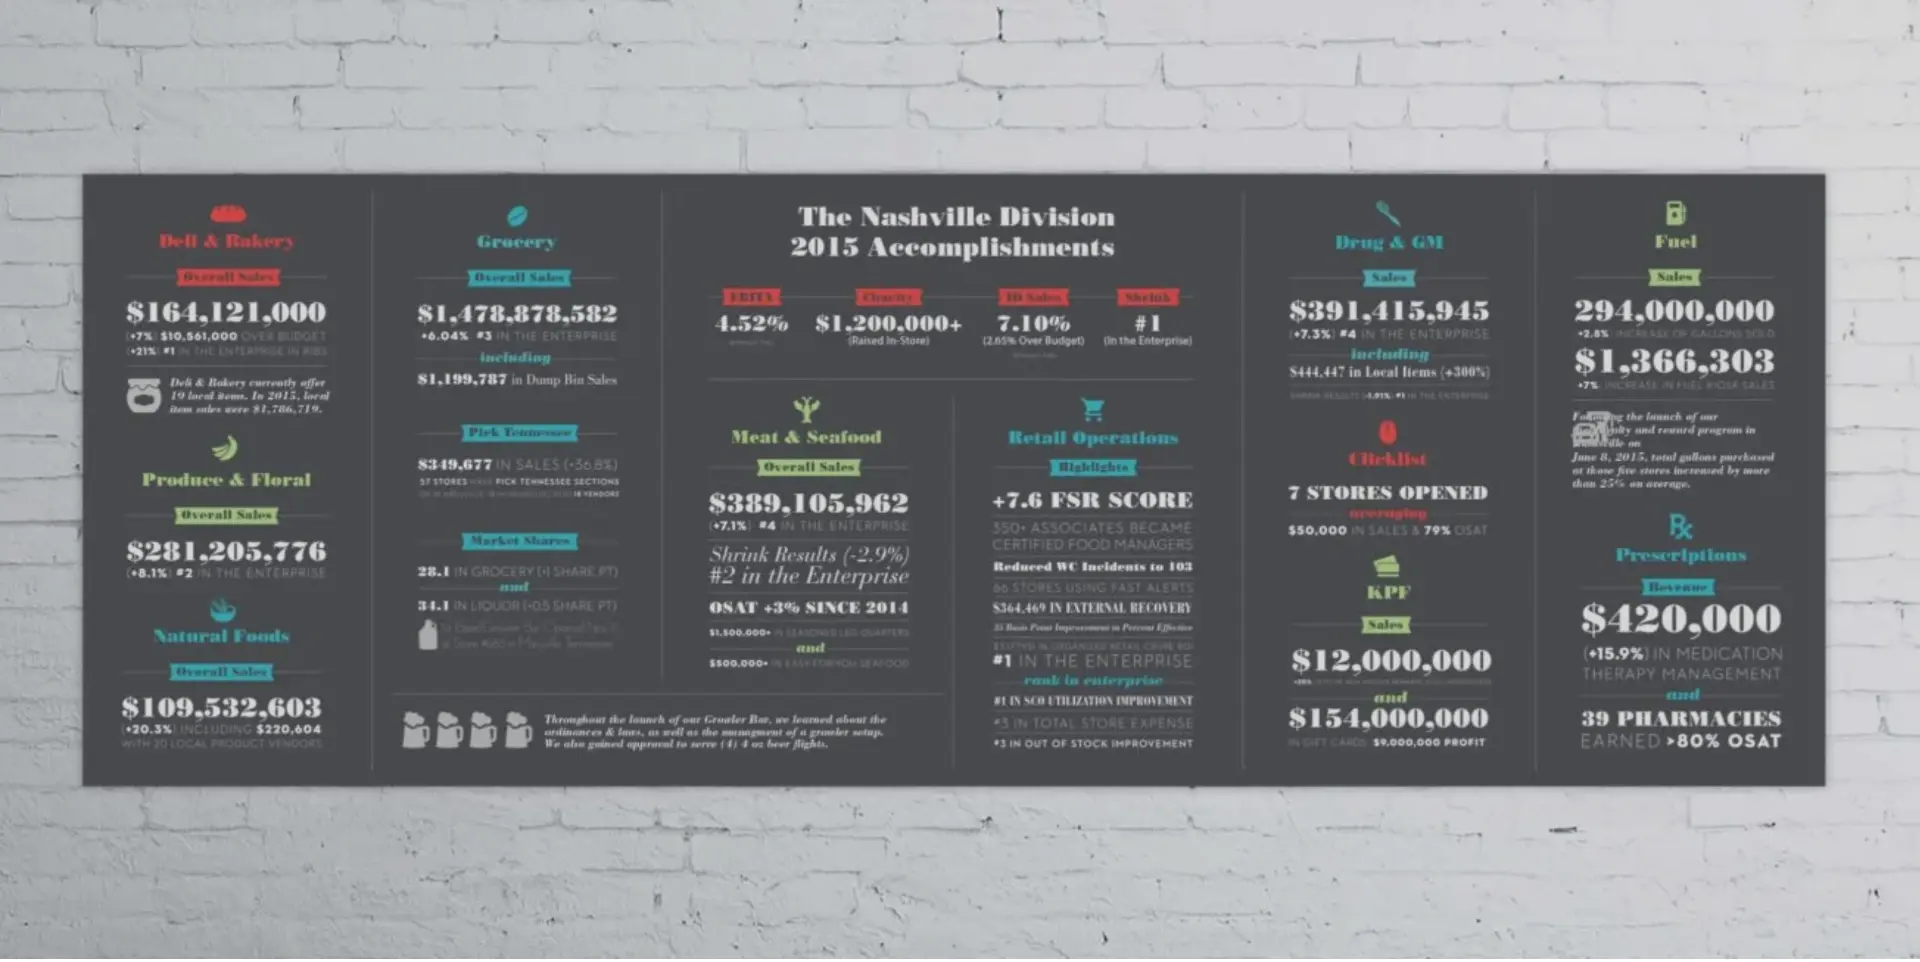
The division’s 2015 accomplishments as one wall: big totals lead, with growth rates and rankings beneath them in a quieter style, so it reads from across a room or up close.
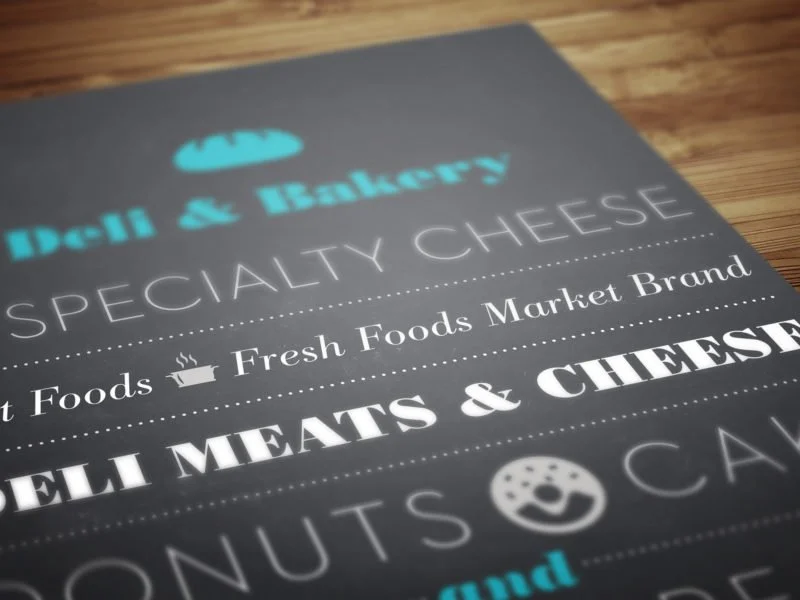

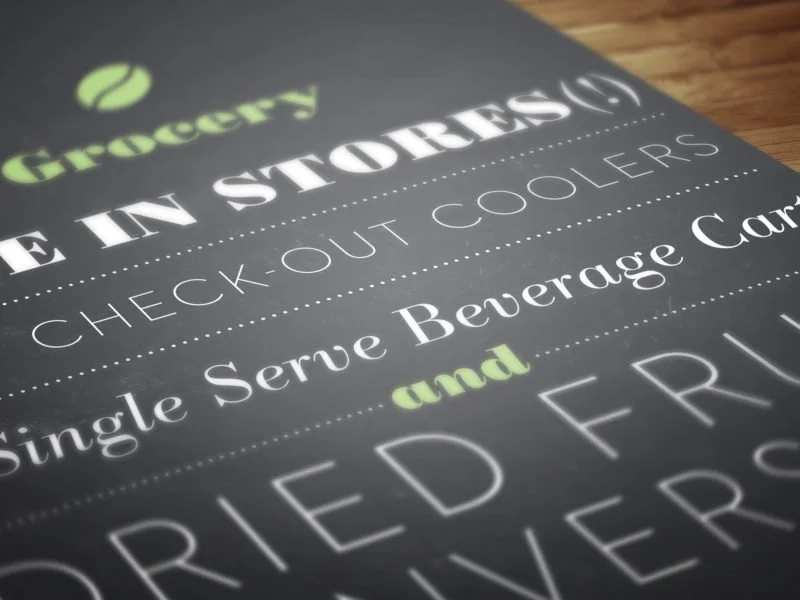
An annual report that expressed the division’s corporate giving and fundraising statistics through infographics and designed narrative.
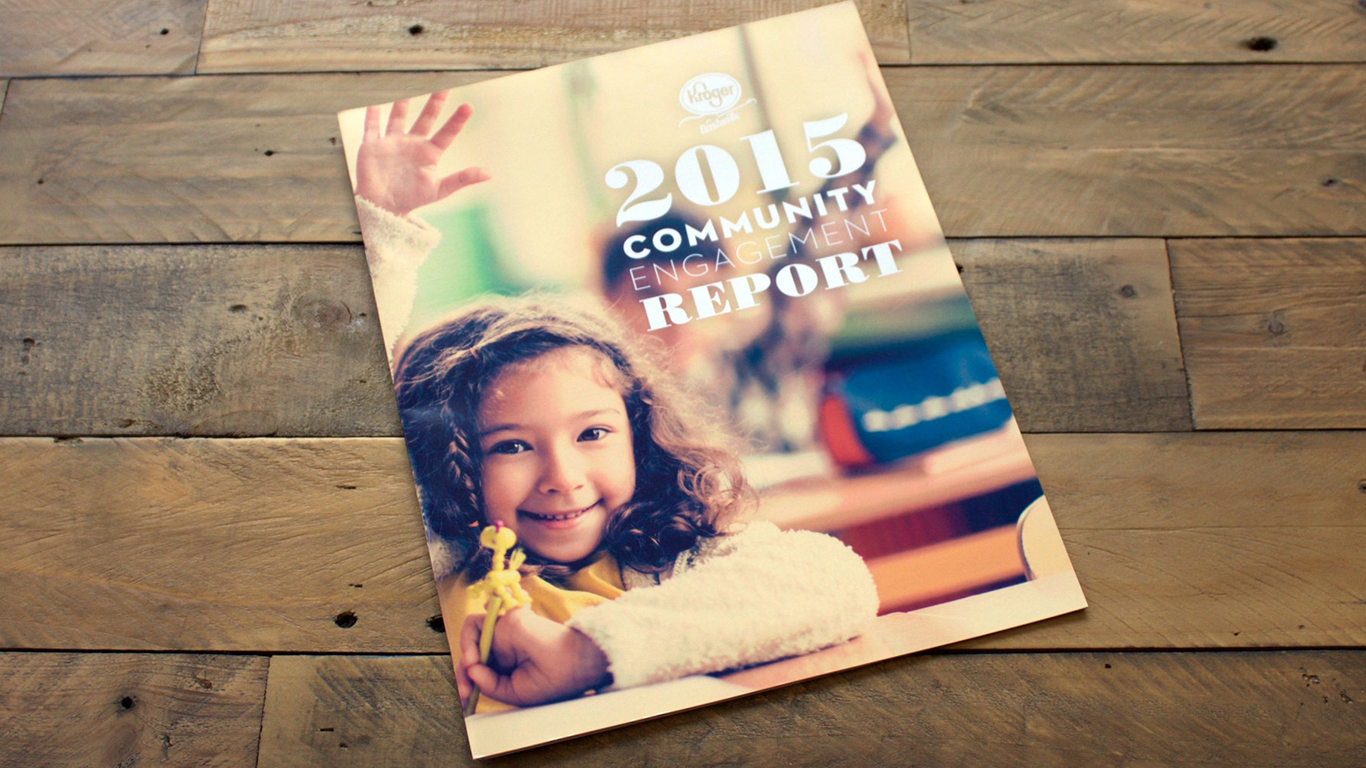
The wall and annual report supported a successful marketing summit, with graphics that made the year's numbers and wins clear at a glance.